Data Science Algorithms: K means clustering
What is K-Means Clustering
General - definition
It is a method of vector quantization, originally from signal processing, that is popular for cluster analysis in data mining. k-means clustering aims to partition n observations into k clusters in which each observation belongs to the cluster with the nearest mean, serving as a prototype of the cluster. This results in a partitioning of the data space into Voronoi cells.
Data Science - definition
It is a type of unsupervised learning, which is used when you have unlabeled data (i.e., data without defined categories or groups). The goal of this algorithm is to find groups in the data, with the number of groups represented by the variable K. The algorithm works iteratively to assign each data point to one of K groups based on the features that are provided. Data points are clustered based on feature similarity. The results of the K-means clustering algorithm are:
- The centroids of the K clusters, which can be used to label new data
- Labels for the training data (each data point is assigned to a single cluster) Read More
This algorithm aims at minimizing an objective function know as squared error function given by:
where,
‘||xi - vj||’ is the Euclidean distance between xi and vj.
‘ci’ is the number of data points in ith cluster.
‘c’ is the number of cluster centers.
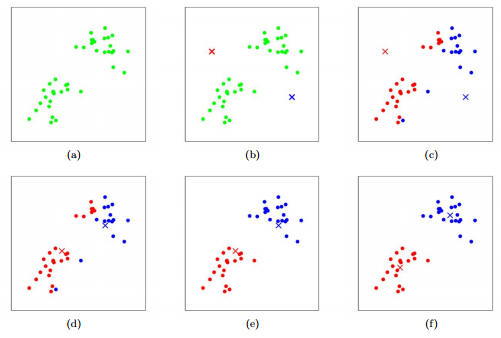
K-Means finds the best centroids by alternating between (1) assigning data points to clusters based on the current centroids (2) chosing centroids (points which are the center of a cluster) based on the current assignment of data points to clusters.

Figure : K-means algorithm. Training examples are shown as dots, and cluster centroids are shown as crosses. (a) Original dataset. (b) Random initial cluster centroids. (c-f) Illustration of running two iterations of k-means. In each iteration, we assign each training example to the closest cluster centroid (shown by "painting" the training examples the same color as the cluster centroid to which is assigned); then we move each cluster centroid to the mean of the points assigned to it. Images courtesy of Michael Jordan.
Algorithmic steps for k-means clustering
Let X = {x1,x2,x3,……..,xn} be the set of data points and V = {v1,v2,…….,vc} be the set of centers.
- Randomly select ‘c’ cluster centers.
- Calculate the distance between each data point and cluster centers.
- Assign the data point to the cluster center whose distance from the cluster center is minimum of all the cluster centers..
- Recalculate the new cluster center using:

where, ‘ci’ represents the number of data points in ith cluster.
- Recalculate the distance between each data point and new obtained cluster centers.
- If no data point was reassigned then stop, otherwise repeat from step 3).
Advantages
- Fast, robust and easier to understand.
- Relatively efficient: O(tknd), where n is # objects, k is # clusters, d is # dimension of each object, and t is # iterations. Normally, k, t, d << n.
- Gives best result when data set are distinct or well separated from each other.
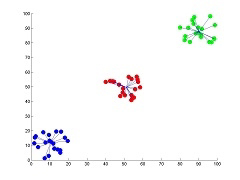
Fig I: Showing the result of k-means for 'N' = 60 and 'c' = 3
Note: For more detailed figure for k-means algorithm please refer to k-means figure sub page.
Disadvantages
- The learning algorithm requires apriori specification of the number of cluster centers.
- The use of Exclusive Assignment - If there are two highly overlapping data then k-means will not be able to resolve that there are two clusters.
- The learning algorithm is not invariant to non-linear transformations i.e. with different representation of data we get different results (data represented in form of cartesian co-ordinates and polar co-ordinates will give different results).
- Euclidean distance measures can unequally weight underlying factors.
- The learning algorithm provides the local optima of the squared error function.
- Randomly choosing of the cluster center cannot lead us to the fruitful result. Pl. refer Fig.
- Applicable only when mean is defined i.e. fails for categorical data.
- Unable to handle noisy data and outliers.
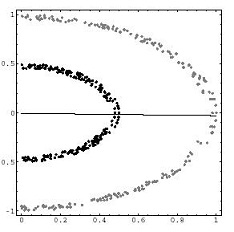
- Algorithm fails for non-linear data set. Read More
Fig II: Showing the non-linear data set where k-means algorithm fails


